8-1. 원자재가격과 주가의 관계 분석_1 [Code]
원자재가격과 주가의 관계 분석
import pandas as pd
from pandas import Series,DataFrame
import numpy as np
from dateutil.parser import parse
import dateutil

# For Visualization
import matplotlib.pyplot as plt
from matplotlib import pyplot
import seaborn as sns
sns.set_style('whitegrid')
%matplotlib inline

# For time stamps
from datetime import datetime

import warnings
warnings.filterwarnings("ignore")
import pandas as pd
import numpy as np
import matplotlib.pyplot as plt
%matplotlib inline
from datetime import datetime

path = "c:/Windows/Fonts/malgun.ttf"
import platform
from matplotlib import font_manager, rc
if platform.system() == 'Darwin':
    rc('font', family='AppleGothic')
elif platform.system() == 'Windows':
    font_name = font_manager.FontProperties(fname=path).get_name()
    rc('font', family=font_name)
else:
    print('Unknown system... sorry~~~~')

plt.rcParams['axes.unicode_minus'] = False
데이터 전처리
KOSPI만 선택
item_Charge = pd.read_csv("st_data_itemChargeFull.tsv", sep = '\t')
item_Charge['date'] = item_Charge['date'].apply(str)
item_Charge['date'] = item_Charge['date'].apply(dateutil.parser.parse)
KOSPI = item_Charge.loc[item_Charge[list(item_Charge.columns)[2]]=="KOSPI",:]
KOSPI.head()
| itemcode | itemname | market | date | close_val | change_val | change_rate | acc_quant | debt_total | face_val | ... | operating_profit | operating_profit_increasing_rate | prev_quant | property_total | reserve_ratio | roa | roe | sales | sales_increasing_rate | trade_stop_yn | |
|---|---|---|---|---|---|---|---|---|---|---|---|---|---|---|---|---|---|---|---|---|---|
| 0 | 000020 | 동화약품 | KOSPI | 2015-01-07 | 5540.0 | 70.0 | 1.26 | 42517.0 | 732.0 | 1000 | ... | 112.0 | NaN | 62744.0 | 3706.0 | 967.43 | NaN | NaN | 3066.0 | NaN | N |
| 1 | 000020 | 동화약품 | KOSPI | 2015-01-13 | 5600.0 | 40.0 | 0.71 | 39527.0 | 732.0 | 1000 | ... | 112.0 | NaN | 62744.0 | 3706.0 | 967.43 | NaN | NaN | 3066.0 | NaN | N |
| 2 | 000020 | 동화약품 | KOSPI | 2015-01-16 | 5640.0 | -110.0 | -1.95 | 57341.0 | 732.0 | 1000 | ... | 112.0 | NaN | 62744.0 | 3706.0 | 967.43 | NaN | NaN | 3066.0 | NaN | N |
| 3 | 000020 | 동화약품 | KOSPI | 2015-01-19 | 5680.0 | 40.0 | 0.70 | 49574.0 | 732.0 | 1000 | ... | 112.0 | NaN | 62744.0 | 3706.0 | 967.43 | NaN | NaN | 3066.0 | NaN | N |
| 4 | 000020 | 동화약품 | KOSPI | 2015-01-22 | 5550.0 | -60.0 | -1.08 | 77386.0 | 732.0 | 1000 | ... | 112.0 | NaN | 62744.0 | 3706.0 | 967.43 | NaN | NaN | 3066.0 | NaN | N |
5 rows × 27 columns
KOSPI_=KOSPI.pivot_table('close_val',index='date',columns='itemname')
KOSPI_clo = KOSPI_.dropna(axis = 1 ).fillna(method='ffill').pct_change().fillna(0)
KOSPI_val = KOSPI_.dropna(axis = 1 ).fillna(method='ffill')
KOSPI_val.head()
| itemname | AJ렌터카 | AK홀딩스 | BGF | BNK금융지주 | BYC | BYC우 | CJ | CJ CGV | CJ대한통운 | CJ씨푸드 | ... | 후성 | 휠라코리아 | 휴니드 | 휴비스 | 휴스틸 | 휴켐스 | 흥국화재 | 흥국화재2우B | 흥국화재우 | 흥아해운 |
|---|---|---|---|---|---|---|---|---|---|---|---|---|---|---|---|---|---|---|---|---|---|
| date | |||||||||||||||||||||
| 2015-01-07 | 17750.0 | 86600.0 | 74500.0 | 13500.0 | 252000.0 | 168500.0 | 158500.0 | 59800.0 | 183500.0 | 2595.0 | ... | 3080.0 | 119000.0 | 4510.0 | 11600.0 | 17350.0 | 25550.0 | 3730.0 | 6140.0 | 2460.0 | 2805.0 |
| 2015-01-13 | 17650.0 | 88000.0 | 73700.0 | 14000.0 | 254000.0 | 170000.0 | 161500.0 | 60500.0 | 192000.0 | 2590.0 | ... | 3245.0 | 118000.0 | 4820.0 | 11750.0 | 17600.0 | 25200.0 | 3900.0 | 6200.0 | 2465.0 | 2655.0 |
| 2015-01-16 | 17300.0 | 92300.0 | 75100.0 | 14000.0 | 252500.0 | 169000.0 | 164500.0 | 59300.0 | 182000.0 | 2560.0 | ... | 3215.0 | 115000.0 | 4970.0 | 11800.0 | 17150.0 | 26800.0 | 4230.0 | 6160.0 | 2410.0 | 2710.0 |
| 2015-01-19 | 17250.0 | 88200.0 | 75100.0 | 14250.0 | 252500.0 | 170500.0 | 164500.0 | 59300.0 | 182000.0 | 2540.0 | ... | 3160.0 | 115500.0 | 5050.0 | 11800.0 | 16850.0 | 27050.0 | 4190.0 | 6300.0 | 2450.0 | 2575.0 |
| 2015-01-22 | 17000.0 | 90300.0 | 75000.0 | 13950.0 | 251000.0 | 175000.0 | 168500.0 | 59600.0 | 172000.0 | 2520.0 | ... | 3205.0 | 116000.0 | 5090.0 | 11650.0 | 16800.0 | 26800.0 | 4175.0 | 6180.0 | 2495.0 | 2570.0 |
5 rows × 802 columns
st_data_goodsForeign = pd.read_csv("st_data_goodsForeign.tsv", sep = '\t')
st_data_goodsForeign['date'] = st_data_goodsForeign['date'].apply(str)
st_data_goodsForeign['date'] = st_data_goodsForeign['date'].apply(dateutil.parser.parse)
st_data_goodsForeign.head()
| itemcode | itemname | date | close_val | change_val | open_val | high_val | low_val | |
|---|---|---|---|---|---|---|---|---|
| 0 | LME@AAY | 알루미늄합금 | 2015-01-07 | 1790.0 | -15.0 | 1790.0 | 1790.0 | 1780.0 |
| 1 | LME@AAY | 알루미늄합금 | 2015-01-13 | 1835.0 | NaN | 1835.0 | 1835.0 | 1825.0 |
| 2 | LME@AAY | 알루미늄합금 | 2015-01-16 | 1820.0 | NaN | 1820.0 | 1820.0 | 1810.0 |
| 3 | LME@AAY | 알루미늄합금 | 2015-01-19 | 1820.0 | NaN | 1820.0 | 1820.0 | 1810.0 |
| 4 | LME@AAY | 알루미늄합금 | 2015-01-22 | 1870.0 | 10.0 | 1870.0 | 1870.0 | 1860.0 |
goodsForeign=st_data_goodsForeign.pivot_table('close_val',index='date',columns='itemname')
goodsForeign_clo = goodsForeign.fillna(method='ffill').pct_change().fillna(0)
goodsForeign_val = goodsForeign.fillna(method='ffill')
goodsForeign_val.head()
| itemname | 구리 | 난방유 | 납 | 니켈 | 대두 | 대두박 | 대두유 | 설탕 | 소맥 | 쌀 | 아연 | 알루미늄합금 | 옥수수 | 주석 | 천연가스 |
|---|---|---|---|---|---|---|---|---|---|---|---|---|---|---|---|
| date | |||||||||||||||
| 2015-01-07 | 6170.0 | 1.6999 | 1820.0 | 15455.0 | 1065.6 | 368.5 | 32.98 | 14.78 | 579.4 | 11.410 | 2145.5 | 1790.0 | 411.4 | 19680.0 | 2.871 |
| 2015-01-13 | 5915.0 | 1.6330 | 1800.5 | 14780.0 | 1015.6 | 349.7 | 32.39 | 14.87 | 548.0 | 11.240 | 2083.0 | 1835.0 | 400.2 | 19555.0 | 2.943 |
| 2015-01-16 | 5660.0 | 1.6656 | 1766.5 | 14360.0 | 1003.0 | 326.2 | 33.39 | 15.33 | 532.6 | 11.325 | 2056.5 | 1820.0 | 401.0 | 19325.0 | 3.127 |
| 2015-01-19 | 5671.0 | 1.6411 | 1827.5 | 14400.0 | 1003.0 | 326.2 | 33.39 | 15.33 | 532.6 | 11.325 | 2068.5 | 1820.0 | 401.0 | 19280.0 | 2.995 |
| 2015-01-22 | 5742.0 | 1.6379 | 1881.5 | 14720.0 | 988.6 | 330.1 | 31.97 | 15.91 | 533.6 | 11.160 | 2144.0 | 1870.0 | 399.2 | 19580.0 | 2.835 |
TD = pd.concat([KOSPI_val,goodsForeign_val],axis=1)
TD = TD.reset_index().fillna(method='ffill')
for i in range(0,336):
    if i%3 != 0:
        TD.drop( i,inplace = True)
FTD = TD.set_index('date')
FTD.head()
| itemname | AJ렌터카 | AK홀딩스 | BGF | BNK금융지주 | BYC | BYC우 | CJ | CJ CGV | CJ대한통운 | CJ씨푸드 | ... | 대두박 | 대두유 | 설탕 | 소맥 | 쌀 | 아연 | 알루미늄합금 | 옥수수 | 주석 | 천연가스 |
|---|---|---|---|---|---|---|---|---|---|---|---|---|---|---|---|---|---|---|---|---|---|
| date | |||||||||||||||||||||
| 2015-01-07 | 17750.0 | 86600.0 | 74500.0 | 13500.0 | 252000.0 | 168500.0 | 158500.0 | 59800.0 | 183500.0 | 2595.0 | ... | 368.5 | 32.98 | 14.78 | 579.4 | 11.410 | 2145.5 | 1790.0 | 411.4 | 19680.0 | 2.871 |
| 2015-01-19 | 17250.0 | 88200.0 | 75100.0 | 14250.0 | 252500.0 | 170500.0 | 164500.0 | 59300.0 | 182000.0 | 2540.0 | ... | 326.2 | 33.39 | 15.33 | 532.6 | 11.325 | 2068.5 | 1820.0 | 401.0 | 19280.0 | 2.995 |
| 2015-02-03 | 17350.0 | 98000.0 | 85000.0 | 14450.0 | 282000.0 | 171500.0 | 173000.0 | 60200.0 | 200000.0 | 2525.0 | ... | 340.6 | 30.80 | 14.47 | 513.6 | 10.385 | 2146.5 | 1840.0 | 401.0 | 18950.0 | 2.754 |
| 2015-02-12 | 16500.0 | 91500.0 | 88000.0 | 14450.0 | 295000.0 | 170500.0 | 177500.0 | 64700.0 | 197000.0 | 2600.0 | ... | 330.5 | 32.01 | 15.04 | 521.2 | 10.330 | 2129.5 | 1785.0 | 398.2 | 17900.0 | 2.713 |
| 2015-02-27 | 16800.0 | 101000.0 | 89800.0 | 14900.0 | 304500.0 | 186500.0 | 173500.0 | 64300.0 | 181000.0 | 2610.0 | ... | 353.7 | 32.80 | 13.77 | 517.4 | 10.470 | 2060.5 | 1800.0 | 401.2 | 17920.0 | 2.734 |
5 rows × 817 columns
del TD['date']
TD.head()
corr = TD.corr(method = 'pearson')
corr_TD = corr.iloc[:-16,-15:]
corr_TD.head()
| itemname | 구리 | 난방유 | 납 | 니켈 | 대두 | 대두박 | 대두유 | 설탕 | 소맥 | 쌀 | 아연 | 알루미늄합금 | 옥수수 | 주석 | 천연가스 |
|---|---|---|---|---|---|---|---|---|---|---|---|---|---|---|---|
| itemname | |||||||||||||||
| AJ렌터카 | 0.253434 | 0.357430 | -0.180675 | 0.491654 | -0.115987 | 0.033026 | -0.198628 | -0.551920 | 0.578182 | 0.134875 | -0.117926 | 0.354760 | 0.391342 | -0.238737 | 0.049452 |
| AK홀딩스 | 0.284143 | 0.319556 | -0.028906 | 0.572011 | 0.177118 | 0.423597 | -0.119239 | -0.449531 | 0.480114 | 0.331932 | -0.006332 | 0.668936 | 0.434461 | -0.125864 | -0.080484 |
| BGF | -0.840062 | -0.796421 | -0.665365 | -0.663681 | 0.135000 | -0.171780 | 0.112896 | 0.434287 | -0.213475 | -0.261622 | -0.742201 | -0.237837 | 0.009903 | -0.649587 | -0.506187 |
| BNK금융지주 | 0.085814 | 0.101259 | -0.238705 | 0.352453 | 0.075016 | 0.130878 | -0.052747 | -0.365024 | 0.446003 | 0.125338 | -0.264136 | 0.536734 | 0.446926 | -0.389719 | -0.135423 |
| BYC | -0.787079 | -0.844172 | -0.445330 | -0.739622 | 0.107104 | -0.327591 | 0.282540 | 0.573646 | -0.448948 | -0.358966 | -0.559299 | -0.355283 | -0.213558 | -0.434541 | -0.579782 |
데이터 시각화
원자재 가격과 양의 상관관계를 갖는 주식
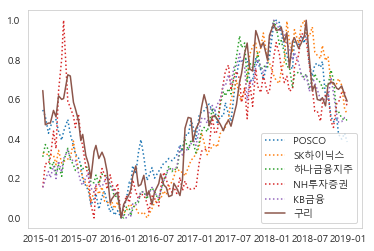
corr_TD.iloc[:,0].sort_values(ascending=False).head()
itemname
POSCO     0.890243
SK하이닉스    0.885247
하나금융지주    0.865733
NH투자증권    0.858859
KB금융      0.854524
Name: 구리, dtype: float64
from sklearn import preprocessing

col = ['POSCO', 'SK하이닉스', '하나금융지주', 'NH투자증권', 'KB금융', '구리']

x = FTD[col].values
min_max_scaler = preprocessing.MinMaxScaler()

x_scaled = min_max_scaler.fit_transform(x.astype(float))
cu = pd.DataFrame(x_scaled, columns = col, index = FTD.index)

cu.head()
| POSCO | SK하이닉스 | 하나금융지주 | NH투자증권 | KB금융 | 구리 | |
|---|---|---|---|---|---|---|
| date | ||||||
| 2015-01-07 | 0.546296 | 0.330261 | 0.309278 | 0.155107 | 0.154161 | 0.644206 |
| 2015-01-19 | 0.513889 | 0.324117 | 0.371134 | 0.274905 | 0.195089 | 0.471332 |
| 2015-02-03 | 0.428241 | 0.319508 | 0.344624 | 0.274905 | 0.234652 | 0.479647 |
| 2015-02-12 | 0.462963 | 0.318740 | 0.243004 | 0.306431 | 0.203274 | 0.479647 |
| 2015-02-27 | 0.490741 | 0.317972 | 0.284242 | 0.438840 | 0.263302 | 0.543911 |
plt.plot(cu['POSCO'],ls = ":", label = 'POSCO')
plt.plot(cu['SK하이닉스'],ls = ":", label = 'SK하이닉스')
plt.plot(cu['하나금융지주'],ls = ":", label = '하나금융지주')
plt.plot(cu['NH투자증권'],ls = ":", label = 'NH투자증권')
plt.plot(cu['KB금융'],ls = ":", label = 'KB금융')
plt.plot(cu['구리'], label = '구리')

plt.legend(loc = 'best')
plt.grid()
plt.show()
plt.savefig('구리.jpg')

<Figure size 432x288 with 0 Axes>
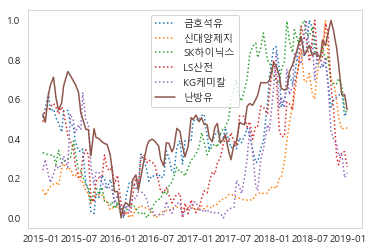
corr_TD.iloc[:,1].sort_values(ascending=False).head()
itemname
금호석유      0.849365
신대양제지     0.792479
SK하이닉스    0.788649
LS산전      0.786274
KG케미칼     0.779705
Name: 난방유, dtype: float64
from sklearn import preprocessing

col = ['금호석유', '신대양제지', 'SK하이닉스', 'LS산전', 'KG케미칼', '난방유']

x = FTD[col].values
min_max_scaler = preprocessing.MinMaxScaler()

x_scaled = min_max_scaler.fit_transform(x.astype(float))
cu = pd.DataFrame(x_scaled, columns = col, index = FTD.index)

cu.head()
| 금호석유 | 신대양제지 | SK하이닉스 | LS산전 | KG케미칼 | 난방유 | |
|---|---|---|---|---|---|---|
| date | ||||||
| 2015-01-07 | 0.508148 | 0.141916 | 0.330261 | 0.486553 | 0.241379 | 0.524168 |
| 2015-01-19 | 0.555556 | 0.112575 | 0.324117 | 0.545232 | 0.295977 | 0.483911 |
| 2015-02-03 | 0.629630 | 0.143713 | 0.319508 | 0.545232 | 0.218391 | 0.624538 |
| 2015-02-12 | 0.540741 | 0.159880 | 0.318740 | 0.559902 | 0.178161 | 0.670546 |
| 2015-02-27 | 0.551111 | 0.171257 | 0.317972 | 0.579462 | 0.221264 | 0.711625 |
plt.plot(cu['금호석유'],ls = ":", label = '금호석유')
plt.plot(cu['신대양제지'],ls = ":", label = '신대양제지')
plt.plot(cu['SK하이닉스'],ls = ":", label = 'SK하이닉스')
plt.plot(cu['LS산전'],ls = ":", label = 'LS산전')
plt.plot(cu['KG케미칼'],ls = ":", label = 'KG케미칼')
plt.plot(cu['난방유'], label = '난방유')

plt.legend(loc = 'best')
plt.grid()
plt.show()

corr_TD.iloc[:,13].sort_values(ascending=False).head()
itemname
카프로      0.838551
LS       0.837574
이구산업     0.816536
POSCO    0.803074
황금에스티    0.779738
Name: 주석, dtype: float64
from sklearn import preprocessing

col = ['카프로', 'LS', '이구산업', 'POSCO', '황금에스티', '주석']

x = FTD[col].values
min_max_scaler = preprocessing.MinMaxScaler()

x_scaled = min_max_scaler.fit_transform(x.astype(float))
cu = pd.DataFrame(x_scaled, columns = col, index = FTD.index)

cu.head()
| 카프로 | LS | 이구산업 | POSCO | 황금에스티 | 주석 | |
|---|---|---|---|---|---|---|
| date | ||||||
| 2015-01-07 | 0.061184 | 0.410669 | 0.062035 | 0.546296 | 0.024415 | 0.741765 |
| 2015-01-19 | 0.218421 | 0.347163 | 0.064516 | 0.513889 | 0.000000 | 0.694706 |
| 2015-02-03 | 0.179605 | 0.359018 | 0.096774 | 0.428241 | 0.018820 | 0.655882 |
| 2015-02-12 | 0.187500 | 0.332769 | 0.114144 | 0.462963 | 0.034588 | 0.532353 |
| 2015-02-27 | 0.228947 | 0.402202 | 0.168734 | 0.490741 | 0.072228 | 0.534706 |
plt.plot(cu['카프로'],ls = ":", label = '카프로')
plt.plot(cu['LS'],ls = ":", label = 'LS')
plt.plot(cu['이구산업'],ls = ":", label = '이구산업')
plt.plot(cu['POSCO'],ls = ":", label = 'POSCO')
plt.plot(cu['황금에스티'],ls = ":", label = '황금에스티')
plt.plot(cu['주석'], label = '주석')

plt.legend(loc = 'best')
plt.grid()
plt.show()

원자재 가격과 음의 상관관계를 갖는 주식
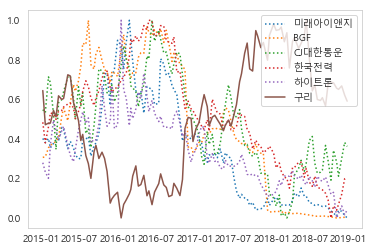
corr_TD.iloc[:,0].sort_values(ascending=True).head()
itemname
미래아이앤지   -0.871926
BGF      -0.840062
CJ대한통운   -0.820994
한국전력     -0.798898
하이트론     -0.793636
Name: 구리, dtype: float64
col = ['미래아이앤지', 'BGF', 'CJ대한통운', '한국전력', '하이트론', '구리']

x = FTD[col].values
min_max_scaler = preprocessing.MinMaxScaler()

x_scaled = min_max_scaler.fit_transform(x.astype(float))
cu = pd.DataFrame(x_scaled, columns = col, index = FTD.index)

cu.head()
| 미래아이앤지 | BGF | CJ대한통운 | 한국전력 | 하이트론 | 구리 | |
|---|---|---|---|---|---|---|
| date | ||||||
| 2015-01-07 | 0.401904 | 0.306223 | 0.547739 | 0.483740 | 0.279188 | 0.644206 |
| 2015-01-19 | 0.381209 | 0.308971 | 0.532663 | 0.379404 | 0.231810 | 0.471332 |
| 2015-02-03 | 0.401904 | 0.354307 | 0.713568 | 0.460705 | 0.200508 | 0.479647 |
| 2015-02-12 | 0.354305 | 0.368045 | 0.683417 | 0.531165 | 0.370558 | 0.479647 |
| 2015-02-27 | 0.377070 | 0.376288 | 0.522613 | 0.525745 | 0.494078 | 0.543911 |
plt.plot(cu['미래아이앤지'],ls = ":", label = '미래아이앤지')
plt.plot(cu['BGF'],ls = ":", label = 'BGF')
plt.plot(cu['CJ대한통운'],ls = ":", label = 'CJ대한통운')
plt.plot(cu['한국전력'],ls = ":", label = '한국전력')
plt.plot(cu['하이트론'],ls = ":", label = '하이트론')
plt.plot(cu['구리'], label = '구리')

plt.legend(loc = 'best')
plt.grid()
plt.show()

corr_TD.iloc[:,1].sort_values(ascending=True).head()
itemname
BYC      -0.844172
NPC      -0.827650
동성화학     -0.823397
조일알미늄    -0.821647
미래아이앤지   -0.814216
Name: 난방유, dtype: float64
col = ['BYC', 'NPC', '동성화학', '조일알미늄', '미래아이앤지', '난방유']

x = FTD[col].values
min_max_scaler = preprocessing.MinMaxScaler()

x_scaled = min_max_scaler.fit_transform(x.astype(float))
cu = pd.DataFrame(x_scaled, columns = col, index = FTD.index)

plt.plot(cu['BYC'],ls = ":", label = 'BYC')
plt.plot(cu['NPC'],ls = ":", label = 'NPC')
plt.plot(cu['동성화학'],ls = ":", label = '동성화학')
plt.plot(cu['조일알미늄'],ls = ":", label = '조일알미늄')
plt.plot(cu['미래아이앤지'],ls = ":", label = '미래아이앤지')
plt.plot(cu['난방유'], label = '난방유')

plt.legend(loc = 'best')
plt.grid()
plt.show()

corr_TD.iloc[:,13].sort_values(ascending=True).head()
itemname
한세예스24홀딩스   -0.901462
쿠쿠홀딩스       -0.885435
S&T홀딩스      -0.884960
전방          -0.870637
사조해표        -0.868335
Name: 주석, dtype: float64
col = ['한세예스24홀딩스', '쿠쿠홀딩스', 'S&T홀딩스', '전방', '사조해표', '주석']

x = FTD[col].values
min_max_scaler = preprocessing.MinMaxScaler()

x_scaled = min_max_scaler.fit_transform(x.astype(float))
cu = pd.DataFrame(x_scaled, columns = col, index = FTD.index)

plt.plot(cu['한세예스24홀딩스'],ls = ":", label = '한세예스24홀딩스')
plt.plot(cu['쿠쿠홀딩스'],ls = ":", label = '쿠쿠홀딩스')
plt.plot(cu['S&T홀딩스'],ls = ":", label = 'S&T홀딩스')
plt.plot(cu['전방'],ls = ":", label = '전방')
plt.plot(cu['사조해표'],ls = ":", label = '사조해표')
plt.plot(cu['주석'], label = '주석')

plt.legend(loc = 'best')
plt.grid()
plt.show()
